RunSight AI
Open Source Running Analytics
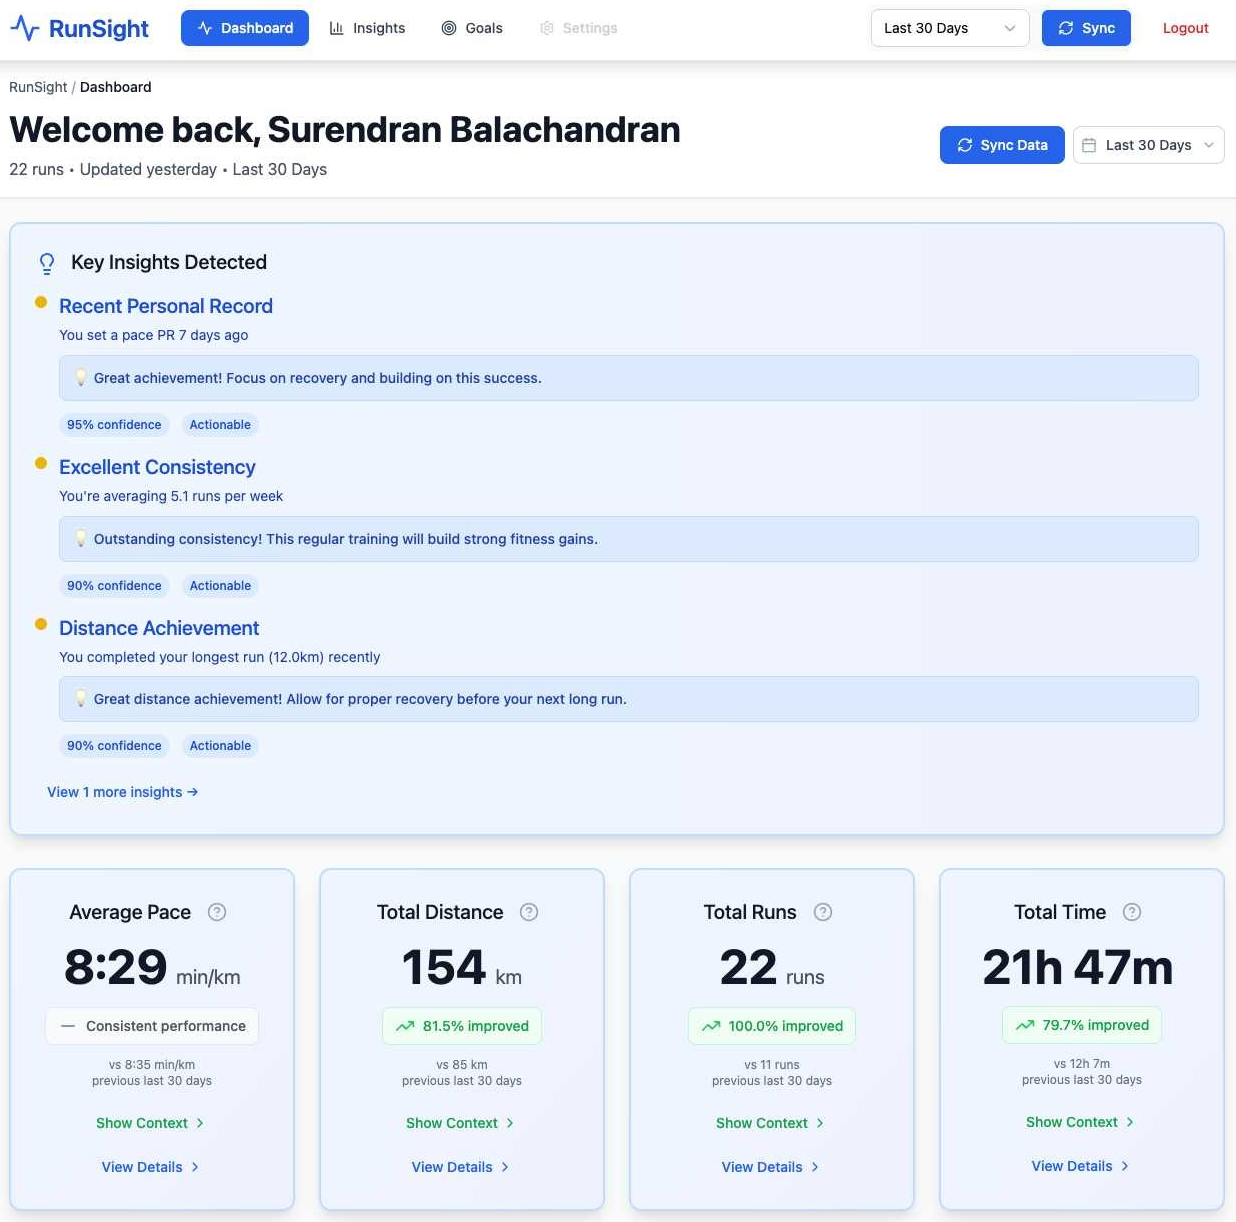
See how weather affects your pace, discover your best running conditions, and get personalized insights that help you run smarter. All from your existing Strava data.
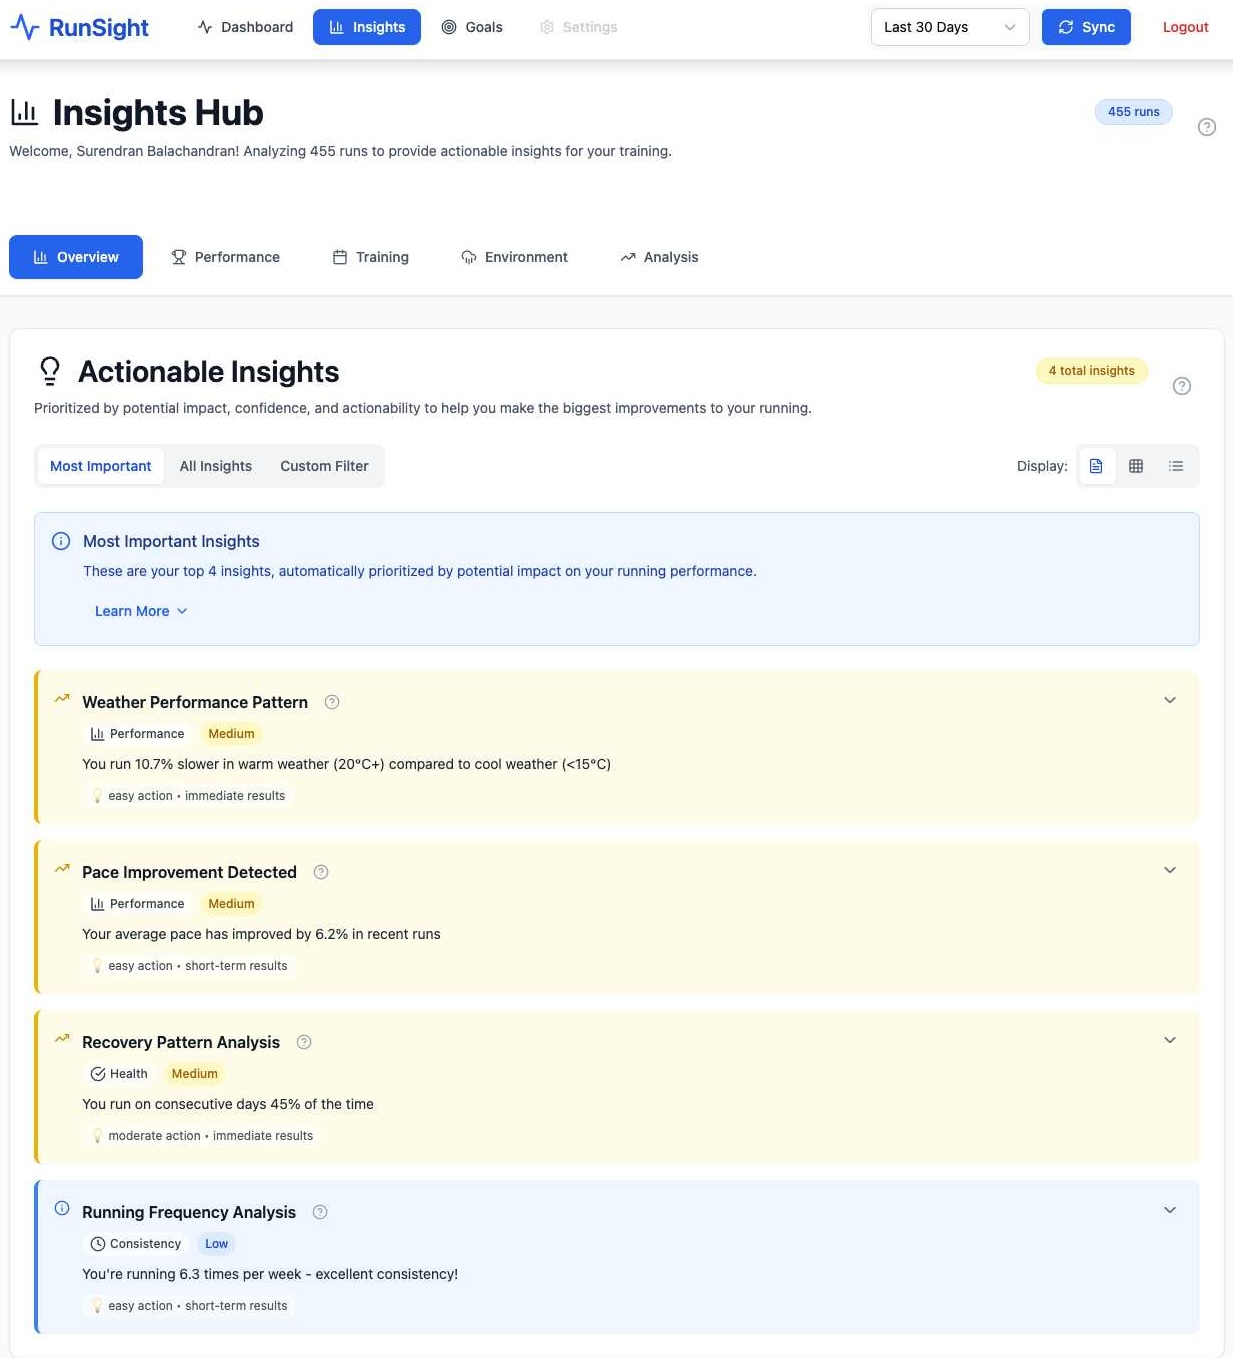
AI-powered insights
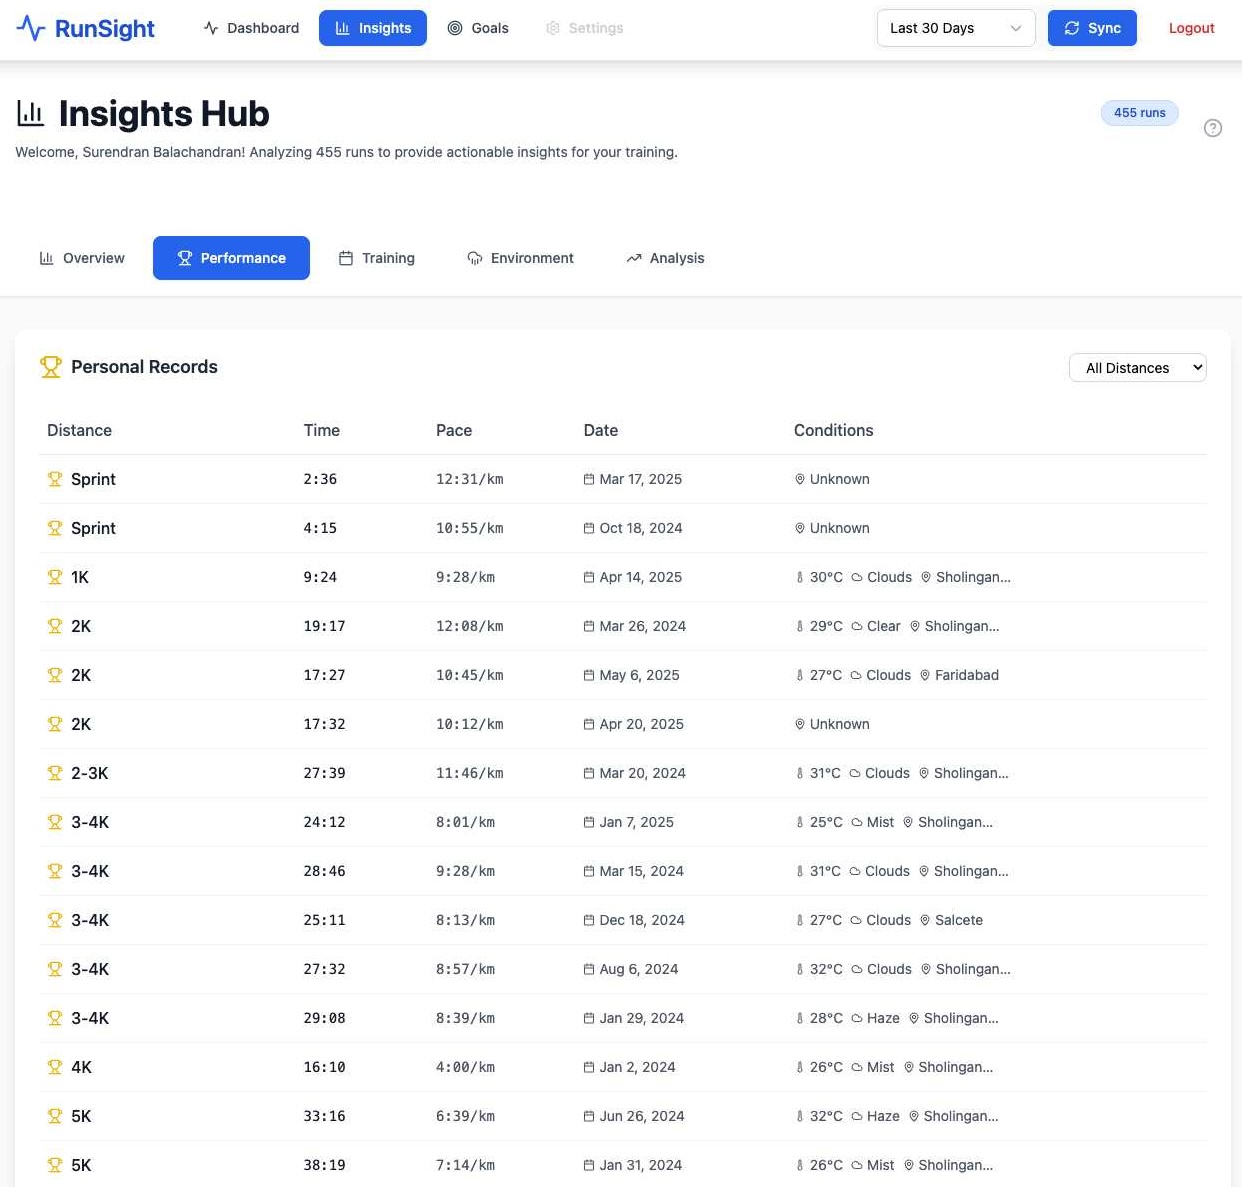
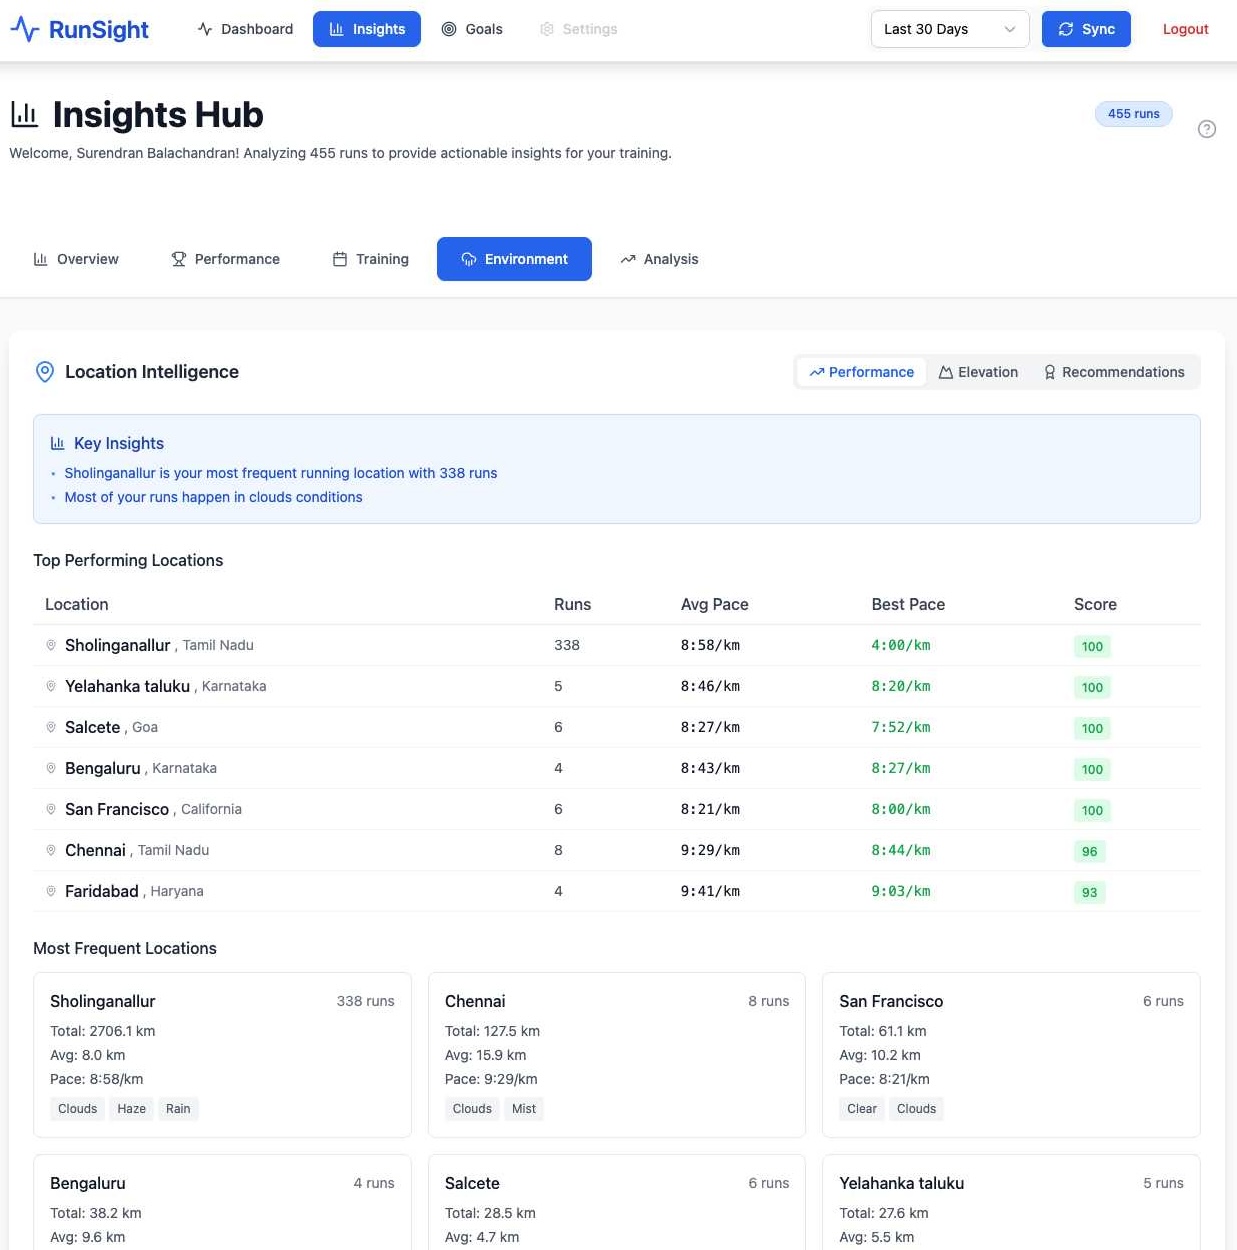
Weather analysis
Privacy-first
Open source